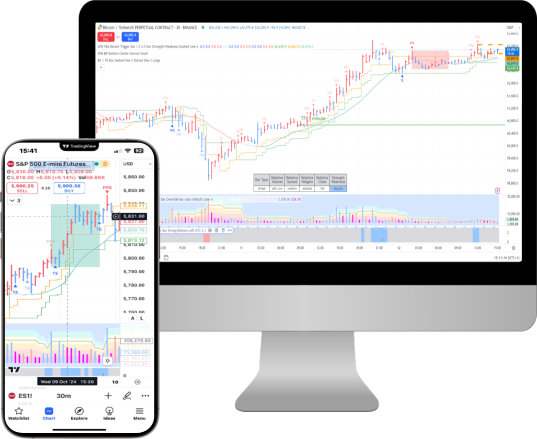
ATM Trading Software
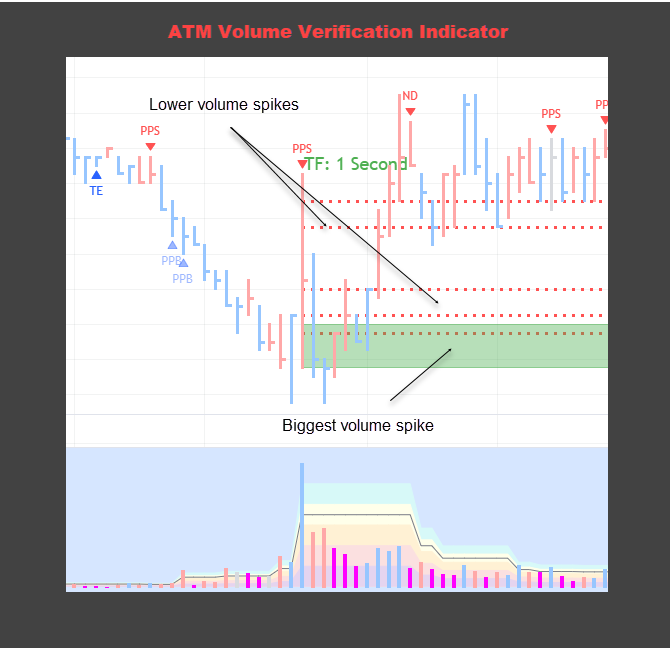
The ATM VSA Indicator is a powerful tool used in chart analysis to interpret the relationship between price movements, trading volume and the spread (range) of the price bars. It is designed to identify key market behaviors that can help to anticipate future price action and market turning points, focusing on the principles of Sign of Strength (SOS) and Sign of Weakness (SOW).
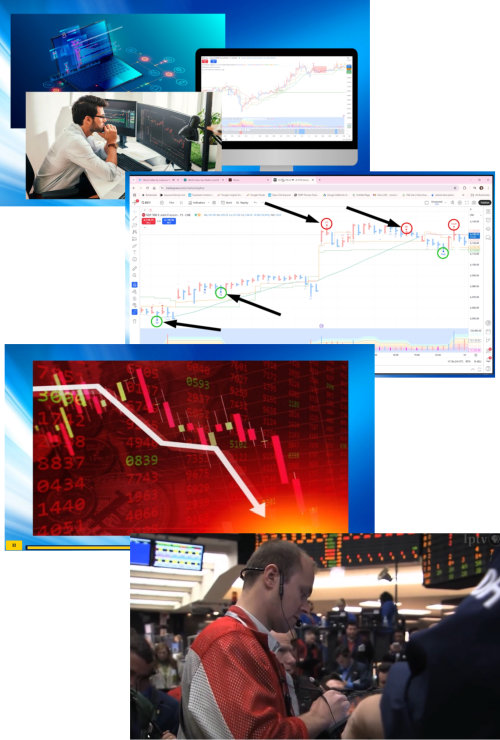
3 key SOSs: Potential Market Strength (PmS), Shakeout (SO) and Test (TE)
3 key SOWs Potential Market Weakness (PmW), Upthrust (UT) and No Demand (ND)
Potential Trigger Bars (PT), which could not be immediately interpreted as SOS or SOW, but could later play a significant role in market moves.
There are 3 further software tools:
The Recent VSA Set up indicator is either a red or green box depending on whether the set up was short or long. This indicator gives a trader a strong indication to start looking for trades in the same direction as the VSA set up
The Stop Loss Management Tool can be used to place the stop loss order while trading
The Retail Trader’s Intention Tool provides information about the general direction of trades taken by retail traders. you can use this tool better identify professional activity. It also helps in identifying entry and exit points.
The ATM VSA Indicator is additionally equipped with filtering options as well as a customizable alert functionality to inform traders about the current market situation.