Phil W – UK
Loading...
The suite consists of:
| The Spike Volume Indicator | |
| The Bar Validation Indicator |
Using a multi-timeframe approach, the suite deconstructs the price action of a chart's bars to reveal the critical volume-based events that occurred within
This provides traders with a significant edge in identifying potential support/resistance zones, breakouts, and reversals.
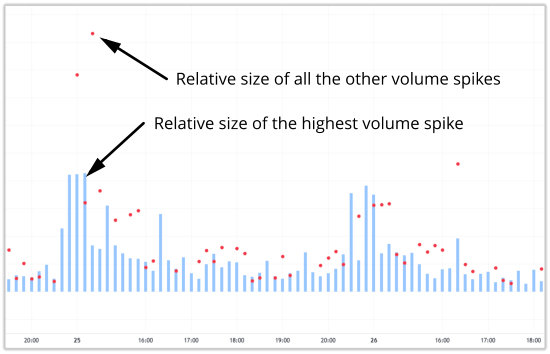
This indicator provides a continuous, bar-by-bar analysis in the selected range of the chart, visualising the intensity and concentration of volume activity within each main bar.
To instantly identify bars with exceptional volume activity across the range
For every bar on the main chart, it loads the data from the validation time frame
It identifies two key elements:
The Biggest Spike: The single bar on the validation time frame with the highest volume during the main bar's duration.
Smaller Spikes: All bars on the validation time frame where volume exceeds a threshold (e.g., 70%) of the Biggest Spike's volume
Reveals professional activity which is often hidden inside the low/average volume bars
Identifies professional support and resistance levels which often become turning points
Saves considerable time-consuming chart analysis of lower time frames
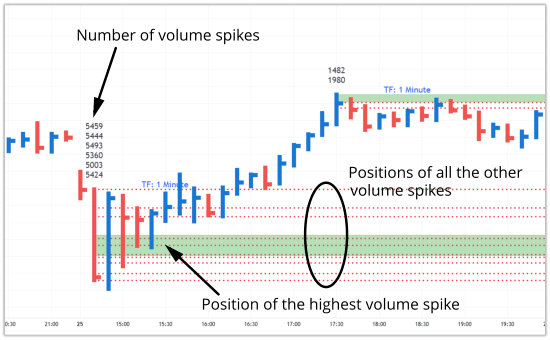
This indicator is a single-bar analysis tool. It is applied to a specific, individual bar on the main chart to dissect its internal structure and define precise price levels.
To define the exact intra-bar support and resistance levels within a single price bar, based on where the highest volume was traded.
The user applies the indicator to a single bar of interest on the main time frame (e.g., a bar with a large volume or the largest spike in range, or a bar at a key level).
The indicator loads the validation time frame data for that specific main bar only
It performs the same analysis as the Spike Volume indicator, identifying the Biggest Spike and Smaller Spikes.
Shows where on the spread of the bar the largest volume appeared
Shows the number of contracts for each bar
Offers level 2 data without requiring it
VSA states that the imbalance between supply and demand drives the market
This imbalance is often revealed through volume spikes (the large professional buying or selling) and the price ranges where they occur.
The key premise: a single large volume bar within a main time frame’s bar often signifies a "sign of strength" (SOS) or "sign of weakness" (SOW) and defines a price level of high institutional interest.
Both indicators use two time frames:
Main Time frame: The chart time frame where the indicators are applied and the trader makes their decisions (e.g., 15-minute or 1-hour).
Validation Time frame: A much lower, usually the lowest available for user time frame in a specified range (e.g., 1-second or 1-minute) is used to analyse the internal structure of each main time frame bar. This high-resolution data acts as a "microscope," revealing the true picture of supply and demand that the bar/candle of the main time frame alone cannot show.