Loading...

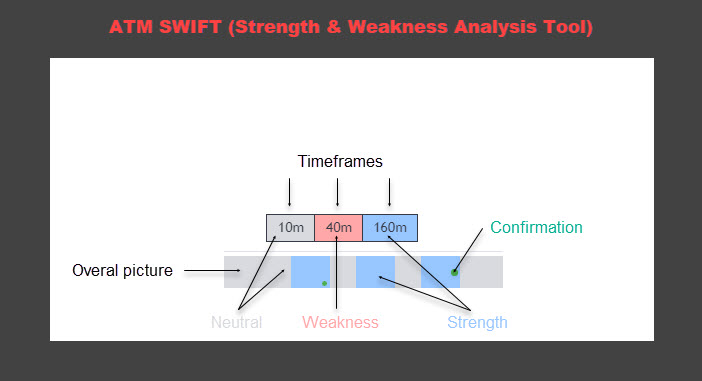
One of the main challenges traders have is to look for trading candidates. For each instrument in question this process requires analysis of several charts, searching for specific patterns, finding corresponding confirmation signals, and calculating risk/reward. It is difficult and time-consuming. Using Volume Spread Analysis which requires a deep study of strength/weakness, adds more challenges. The ATM Strength & Weakness Analysis Tool, or ATM SWIFT indicator as it's also known, helps traders address such issues and saves a lot of time in the trade preparation phase.
The tool does the following:
Looks at 3 timeframes simultaneously
Analyses strength/weakness in each timeframe independently
Displays current snapshot of strength/weakness per each analysed timeframe
Provides overall strength/weaknes of the instrument
Searches, displays and alerts for the VSA confirmation signals
This indicator saves a lot of time and effort for VSA Traders and is an essential part of the ATM Trading Approach.
ATM SWIFT plugs into the TradingView platform.
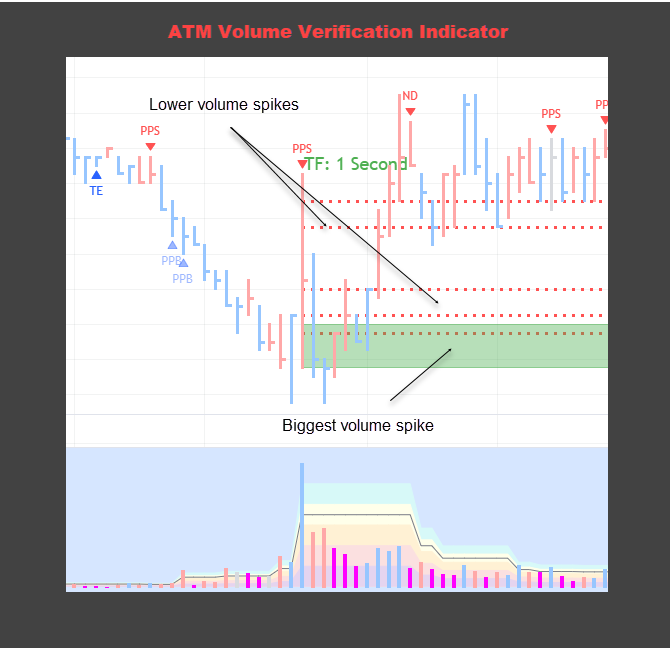
While analysing instruments, you can often see unexpected price behaviour. For example, on the right side of the chart, there is a widespread, high-volume up bar closed around its bottom. In VSA such bars are interpreted as a major sign of weakness and after corresponding confirmations, VSA traders would anticipate a down move. But prices rally instead.
One of the reasons this happens is because of the way smart money is acting on that bar which is not recognisable from analysing the timeframe itself.
Using lower timeframes, the ATM Bar Validation Indicator helps traders understand what professionals are doing during the bar. It provides you with the following information:
The location of the biggest volume spike of the bar
The location of all smaller volume spikes in the pre-configured range of the biggest volume spike of the bar
This indicator saves traders from jumping between charts to interpret professional activity and reducing time and effort.
