Only look for long trades
Loading...
It looks at strength and weakness, in multiple timeframes, and displays this on a chart.
You can then build a complete picture, of strength and weakness over multiple timeframes.
When the timeframes align, the chances of a successful trade set up, are much higher.
Only look for long trades
Only look for short trades
Neutral - don't look for trades
The SWIFT indicator does all the heavy lifting multiple timeframe analysis and provides a dynamic summary of multi-timeframe strength and weakness which provides guidance on future market direction
To instantly identify likely future market direction.
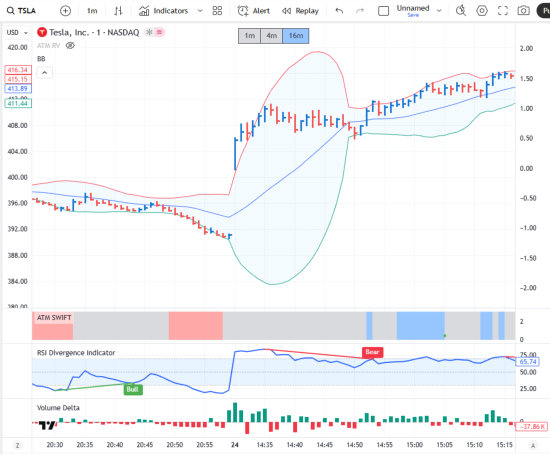
During every bar on the main chart, it analyses strength and weakness on 3 different timeframes including the current one
It identifies two key elements:
A dynamic snapshot of strength and weakness: 3 boxes coloured red for weak, green for strong and grey for neutral for each of the 3 timeframes
Summary bar: A bar that runs across the chart which shows the overall result. Superimposed on the bar are VSA confirmation signals which confirm potential future changes in market direction
Works for all timeframes
Works with all trading methodologies - including the ATM trading approaches
Saves considerable time-consuming chart analysis
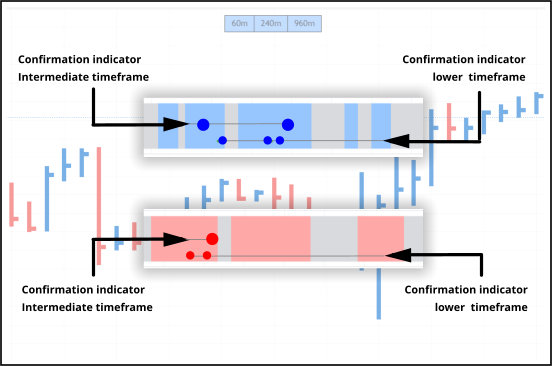
These provide added confirmation of market direction, to provide an additional perspective on market movement
Provides valuable additional benefits:
| Greater consistency | |
| Added accuracy | |
| Extended trades with greater returns |